
Single Source of Truth: What It Means, How to Build One and Why It Matters More in the Age of AI
18 November 2026 · IllumiFi
By Tom Shuttleworth, Co-Founder, IllumiFi Advisory. 20+ years in financial and commercial data leadership.
Businesses do not have a shortage of data, but it is typically sat, siloed in disconnected systems and platforms. They have customer information in their CRM, revenue and costs in their finance system, orders in their sales platform, marketing data across multiple channels and operational information in specialist systems or spreadsheets.
Individually, those systems may work perfectly well. The challenge comes when the business needs to answer a question that crosses more than one of them.
-
Which customers are growing in revenue but declining in margin?
-
Which products are selling strongly but are at risk of running out of stock?
-
Which marketing channels are generating the most valuable customers?
-
Which locations are seeing increasing activity without a corresponding increase in revenue?
-
What has changed this month, where has it changed and what is driving it?
Answering questions like these requires data from different parts of the business to connect, use consistent definitions and be trusted.
That is the real value of creating a single source of truth.
What is a single source of truth?
A single source of truth is a trusted, connected view of the data a business uses to understand its performance.
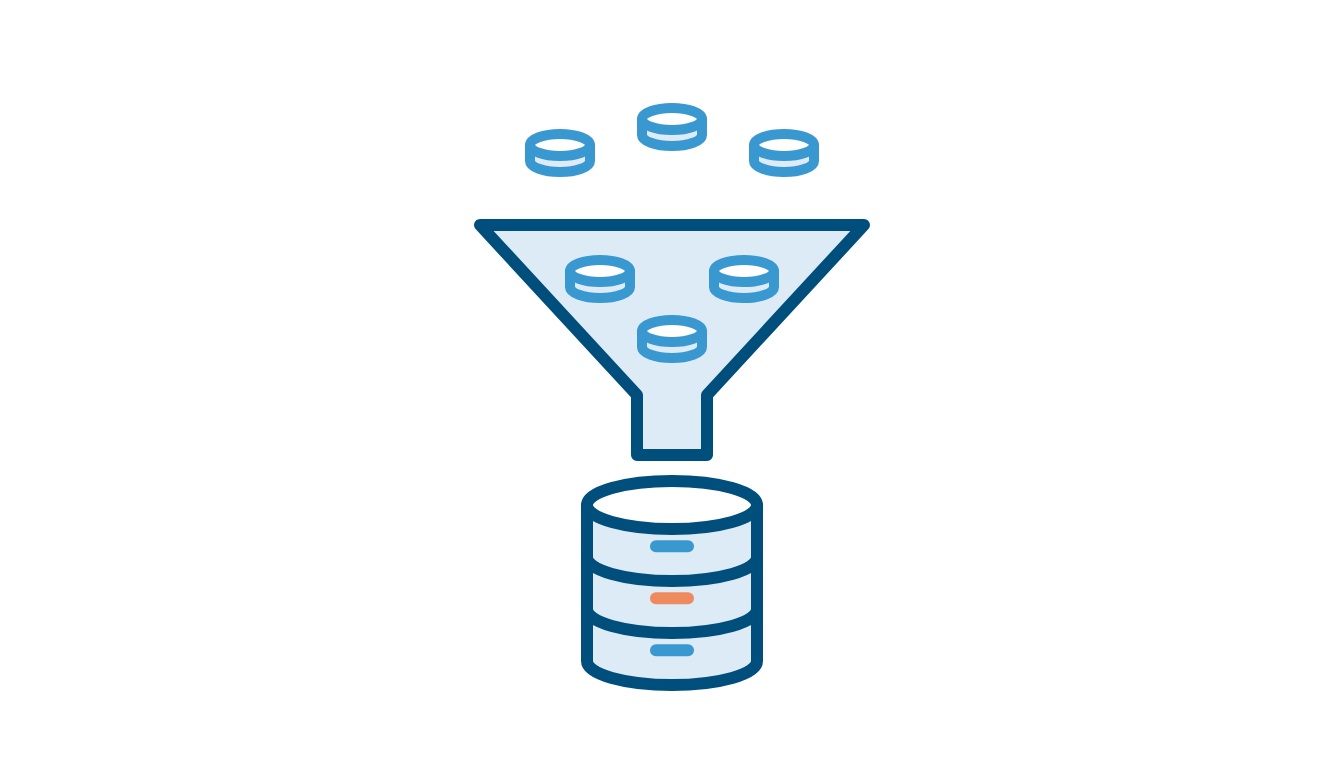
Creating a single source of truth does not mean moving everything into a single operational system. Your CRM can remain your CRM. Your finance platform can continue running finance. Your ecommerce, ERP, marketing and operational systems can continue doing the jobs they were designed to do. Instead, the relevant data from those systems is brought together into a common data foundation.
Within that foundation, data can be cleaned, structured and connected. Common measures can be defined consistently. Relationships between customers, products, transactions, locations and other dimensions can be established.
The result is that different teams can work from the same underlying information rather than producing competing versions of it.
For a simple measure such as revenue, that might mean agreeing whether the business is talking about orders placed, products shipped or invoices raised.
But the greater value comes when multiple measures and systems can be connected.
You can then understand not simply what revenue was, but which customers generated it, which products they bought, what margin was made, how they were acquired and how that performance has changed over time.
Why businesses end up with different versions of the 'truth'.
Different figures across a business rarely mean somebody has done something wrong. More often, they are the natural consequence of growth.
A finance team might calculate revenue from invoices. Sales might look at closed opportunities in the CRM. Operations might measure orders shipped. Marketing may attribute revenue based on the channel that generated the customer.
Each view can be valid for its own purpose. Problems appear when the business starts treating them as interchangeable.
The same happens with customers, products, margin, stock, pipeline and countless other measures. Definitions differ. Naming conventions change. Customer records do not match between systems. Information is captured at different times. Data that exists in one platform never reaches another. Spreadsheets then fill the gaps.
Someone exports data from one system, downloads another file, performs a lookup, corrects some customer names and manually builds the report management needs.
The final answer may be correct. But much of the knowledge required to create it exists in the head of the person preparing it rather than in the data itself.
That creates three problems:
-
First, it takes time.
-
Second, it makes analysis difficult to repeat or scale.
-
Third, confidence in the information becomes dependent on the process and the people producing it.
A single source of truth changes that.
For what the disagreement costs, read how much bad data is costing your business.
What does a single source of truth actually give a business?
The immediate benefit is consistency. If revenue, margin, customers or other important measures have agreed definitions, everyone starts from the same position.
But consistency is only the beginning. The greater value comes from connecting information that was previously separate.
Less time preparing information
Many management reports still involve extracting files, combining spreadsheets, checking formulas and reconciling numbers before anybody can actually analyse them. A connected data foundation can automate much of that process.
Instead of rebuilding the same view every week or month, the underlying data is refreshed and processed consistently. The time previously spent preparing information can then be spent understanding it.
More questions can be answered
Traditional reporting often works well for questions somebody anticipated when the report was created. It is much less effective when somebody asks a new question.
For example:
Why has gross margin fallen this month? The answer may require sales, product, customer and cost data.
Or:
Which customers have reduced their purchasing over the last three months? That may require customer records, order history and product information.
When those datasets are already connected, analysis becomes much easier. The business is no longer limited to the questions somebody happened to build into a spreadsheet or dashboard.
Performance can be understood across the business
A finance system may show overall profitability. A CRM may show customer activity. A sales platform may show orders. A marketing platform may show acquisition. Individually, each tells only part of the story.
When the information is connected, management can move between different levels of performance.
For example:
Business → brand → department → product → customer
or:
Revenue → margin → customer → acquisition channel
This creates a much richer understanding of what is driving performance.
Everyone works from consistent definitions
A connected platform can also create a common semantic layer: a shared set of definitions for the measures used across the business.
Revenue then means the same thing wherever it appears. Gross margin is calculated consistently. Customer categories use the same rules. Measures do not change depending on which spreadsheet somebody happens to open.
That consistency becomes particularly important as more systems start consuming the same information.
How do you create a single source of truth?
It is tempting to start with technology. However, the most successful implementations start with the questions the business needs to answer. The technology comes afterwards.
1. Start with the questions that matter
Identify the areas where better connected information would have the greatest value.
That might be understanding profitability by customer. It could be connecting sales and stock to improve purchasing. It might be combining marketing spend with customer value. Or it could simply be removing the monthly exercise of manually producing management information.
Starting with a practical business requirement keeps the project focused. You do not need to connect every piece of data in the company on day one.
2. Identify the data needed to answer those questions
Once the questions are clear, identify the systems that contain the relevant information. A customer profitability view might require:
- finance data for revenue and cost;
- CRM data for customer ownership or segmentation;
- order data for products purchased;
- operational data for fulfilment or service costs.
This also exposes gaps. For example, two systems may both contain customer records but use different identifiers. That problem needs resolving before the information can be reliably joined.
3. Connect the systems
The relevant information can then be brought into a common data environment. This is where the technical integration happens.
The objective is not simply to copy data from several systems into one place. The data needs to be connected in a way that preserves the relationships between it.
An invoice should be capable of being linked to a customer. An order should be capable of being linked to the products within it. Where relevant, those transactions might also connect to salespeople, locations, campaigns or suppliers.
Those relationships are what allow the business to ask more useful questions later.
4. Clean and standardise the data
Information coming from different systems rarely arrives perfectly aligned.
Dates may use different formats. Customer names might vary. Product identifiers may not match. Missing values and duplicates may exist.
Those issues need to be identified and, where appropriate, resolved systematically. The aim is not necessarily to create perfect data. It is to create data that is sufficiently reliable and structured for the questions the business needs to answer.
5. Agree common definitions
The business then needs to decide what its important measures actually mean.
Revenue is an obvious example. Does it mean orders placed, goods shipped or invoices raised? How are returns treated? Does the measure include VAT? Which date determines the reporting period?
The same principle applies to margin, active customers, new customers, pipeline and other KPIs.
Those definitions should be documented and consistently applied. Keep each one short enough that a new starter could apply it. If you need background on how definitions fit with objectives and decisions, read what a KPI framework is.
6. Validate the outputs
Before the information becomes trusted, key measures should be reconciled to the underlying systems.
If the platform reports £1.2 million of revenue for the month, it should be possible to establish why that number agrees with, or legitimately differs from, the relevant finance records.
That validation is critical. A sophisticated dashboard displaying an incorrect number more quickly does not solve the underlying problem.
7. Make the information accessible
Once the foundation exists, the information can be surfaced in the way the business needs.
That might include automated management dashboards. It might include detailed analysis. It could support forecasting models, alerts or operational workflows. Increasingly, it may also mean allowing people to ask questions of the data using natural language.
The foundation remains the same. What changes is how people interact with it.
A dashboard is not a single source of truth
This distinction matters. A dashboard is a way of presenting information. It does not automatically make the information underneath it reliable.
If three systems contain three different versions of a customer, connecting all three to Power BI does not resolve the disagreement. You simply have a better visualisation of inconsistent data.
The same applies to a data warehouse. A warehouse provides somewhere to store and organise data from multiple systems. It can be an important component of a modern data environment. But simply moving inconsistent data into a warehouse does not create a single source of truth.
The value comes from what happens around it: connecting the data correctly, defining measures consistently, resolving quality issues and creating a reliable data model that the rest of the business can use.
Why a single source of truth matters even more as AI develops
For many businesses, poor data foundations have historically been inconvenient rather than prohibitive.
A spreadsheet could bridge the gap. Someone in finance knew which adjustment to make. A sales manager understood which opportunities in the CRM were genuine. An analyst knew that two differently named customers were actually the same company. Human intervention compensated for weaknesses in the underlying data.
AI changes that equation. Businesses are increasingly looking at AI assistants, copilots, agents and natural-language analytics to help people interact with information more quickly.
The attraction is obvious. Instead of navigating multiple reports, someone might simply ask:
Which customers have seen the largest decline in margin this quarter, and why?
Or:
Which products are likely to face a stock shortage over the next six weeks?
Or:
What are the main factors behind the reduction in profitability this month?
Those questions can be extraordinarily valuable. But the quality of the answer depends on the information the AI can access.
If customer records are inconsistent, measures are calculated differently or important relationships between datasets have never been established, AI has the same underlying problem the business already had.
It simply encounters it faster.
AI cannot reliably compensate for an undefined business metric
Imagine asking an AI tool:
What was our revenue last month?
If the CRM contains one number, the finance system another and the ecommerce platform a third, which one should it use?
A person inside the business may understand the distinction. An AI system needs that context to be encoded somewhere.
This is where consistent definitions and a semantic layer become increasingly important. The business needs to establish what its metrics mean before it can expect an AI system to interpret them reliably.
AI also increases the importance of connected data
Many of the most interesting AI use cases require information from several systems.
A useful answer to: Which customers should we prioritise this week? might depend on recent purchases, margin, pipeline, service activity and payment behaviour.
If those datasets remain disconnected, the AI can only work with fragments of the picture. Connect them, and the range of questions that can be answered increases significantly.
That is why we increasingly see the data foundation and AI discussion as part of the same journey.
The immediate value of connected data may be automated reporting or more flexible analysis. The longer-term value is that the same trusted foundation can support forecasting, advanced analytics, automation and AI.
You do not need to solve everything at once
Creating a single source of truth can sound like a major transformation programme. It does not have to be.
A sensible starting point is often one important business problem. For example, a retailer wanting to understand stock cover and future replenishment requirements might begin by connecting:
sales + stock + purchasing
Another business wanting to understand customer profitability might start with:
customers + revenue + cost
A third wanting to compare pipeline, orders and realised revenue might connect:
CRM + finance
Once that initial foundation exists, other data and use cases can be added over time.
The aim is not to build the perfect enterprise data platform before anybody receives value. It is to build the foundation correctly enough that the value can expand as the business does.
For more insight on how to build the right foundations to enable AI to add value to your business read our AI-Ready Data Strategy.
What this can look like in practice
For one UK ecommerce retailer with annual revenue of approximately £25m, IllumiFi built a connected analytics platform that created one consistent KPI layer across the business.
Instead of different reports applying different definitions, the same underlying measures were used across company, brand and departmental reporting. The platform was built from scratch in under three months.
The results of investing in this capability included:
- 750+ hours of reporting effort saved each year
- 71% return on investment over the first 12 months
- 7-month payback period
But the more important change was structural.
The business no longer had to rebuild its view of performance every time it wanted to understand what was happening. The underlying data foundation already existed. New reporting and analysis could build from that same connected information rather than starting again from spreadsheets and exports.
Read the e-commerce retailer case study.
The real value of a single source of truth
A single source of truth is sometimes presented as a reporting project. Its value is much broader than that.
Done properly, it gives a business a reusable data foundation. It reduces the manual effort involved in producing information. It creates consistent definitions building trust in the data and enabling faster decisions. It makes cross-business analysis easier giving you insights into performance you may never have been able to see before. And it creates a foundation layer needed for forecasting, automation, advanced analytics and AI to be successfully implemented.
As AI becomes more accessible, the importance of that foundation is likely to increase rather than diminish. The businesses that get the most value from AI will not simply be those that have access to the newest tools. They will be the ones whose data those tools can understand and trust.
At IllumiFi, we help businesses connect data across their existing systems and turn it into one trusted view of performance. We can start with a specific reporting, analysis or data challenge and build the foundation from there, developing it as the business and its requirements grow.
How IllumiFi Advisory builds and runs a single source of truth for SMEs
We agree the definitions, owners and reconciliations with you in Data Foundations, then build and run the live platform as the Analytics Platform. You can start with either Data Foundations or the Analytics Platform. Data Foundations gets fragmented, low-trust data into shape, and we run the Analytics Platform as an always-on service.
The seven steps map to our services like this:
| Step | Where IllumiFi does it | Deliverable |
|---|---|---|
| 1. Start with the questions that matter | KPI Insight and Design | Feasibility Matrix |
| 2. Identify the data needed to answer those questions | Data Environment | Data System Map |
| 3. Connect the systems | Analytics Platform | The connected platform |
| 4. Clean and standardise the data | Data Integrity | Data Quality and Risk Report |
| 5. Agree common definitions | KPI Insight and Design, Data Governance | KPI Bible, Remediation and Governance Roadmap |
| 6. Validate the outputs | Data Integrity | Data Quality and Risk Report |
| 7. Make the information accessible | Dashboard and Visualisation | Dashboard Mock-Up, Analytics Roadmap |
Each module runs to a fixed timeline, agreed with you before it starts. Run them standalone or stack them.
The Analytics Platform is where the definitions stay true. It gives you one documented data model and metric glossary, and live dashboards your leadership team can read without anyone preparing them. We build it and run it, and we update it when the business changes. It connects to the systems you already use, and you do not need an internal data team to run it.
We run your data and analytics, so you run the business.
Frequently asked questions
What is the difference between a single source of truth and one version of the truth?
A single source of truth is where each number lives and who owns it. One version of the truth means people agree what the number means.
Who can build and run one for a growing business?
There are three routes. You can build it in-house, hire a senior data owner, or have a team run it for you. IllumiFi Advisory runs it for UK businesses through the Analytics Platform, which is built and maintained by us. Whichever route you take, write the definitions and owners down before the dashboard is built.
Do we need a data warehouse to have a single source of truth?
No. A warehouse can hold the data, but agreed definitions and named owners are what make a number a source of truth. You can agree the numbers first, then choose the storage that fits.
Who should own the single source of truth, finance or IT?
A finance leader usually owns the definitions for financial metrics such as revenue and margin, whereas an Ops leader may own metrics covering efficiency and utilisation. Each metric must have its own named owner. It is then the responsibility of IT or a data lead to keep the connections working. If nobody can take that role, we offer Advisory Support that can help bridge the gap on a fractional or short-term basis.
Sources
- IllumiFi Advisory, Data Foundations
- IllumiFi Advisory, Analytics Platform
- IllumiFi Advisory, Advisory Support
- IllumiFi Advisory, From Manual Reporting to Automated Commercial Visibility
- IllumiFi Advisory, How SMEs Should Build A Data Platform, Without Hiring A Data Team
- IllumiFi Advisory, About
- Microsoft Learn, Semantic Models in the Power BI Service
- Xero, Accounting software for UK businesses
- HubSpot, CRM
Want this kind of thinking for your team?
30-min call. We will talk through how this applies to your numbers, or send you back to your day with a sharper question.